Dependencies – Layers
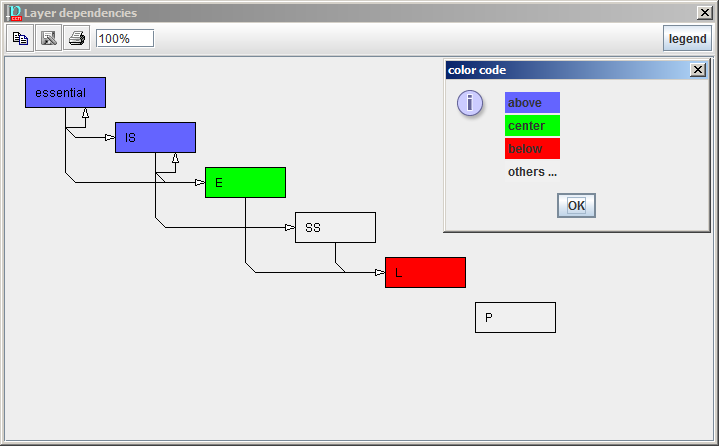
The graph shows the relationships between layers. A layer L1 depends on a layer L2 if there is at least one asset in L1 that depends on at least one asset in L2.
If the model is "clean"
- layers above only depend on layers below
- layers below only depend on layer above
- there may be internal dependencies within layers
That is not mandatory; but projects that do not adhere to the rule are harder to understand and to explain.
When you click on one layer, the graph gets colour:
|
deep blue |
directly related layers above |
|
green |
the reference layer |
|
bright red |
directly related layers below |
|
grey |
unrelated |
|
|
copy |
Copies the image to the note pad to paste it somewhere else. |
|
|
save |
to store the picture as an image file. The available image formats depend on the hosting machine; some formats are quite widespread: jpg, jpeg, png |
|
|
|
to send the picture to a printer |
|
|
scale |
to enlarge / decrease the image |
|
|
legend |
show the colour codes |


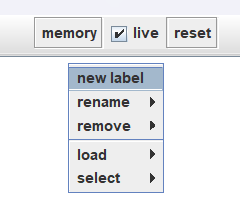
These graphs provide a MEMORY button to memorize layouts with a name
|
new label |
Defines a new label with a name |
|
rename |
Renames the label |
|
remove |
Remove the label |
|
load |
The current diagram is recorded for the label |
|
select |
Recovers the diagram loaded onto the label |
Created with the Personal Edition of HelpNDoc: Free help authoring environment